Frozen 4H VWAP – Precision AnchoredFrozen 4H VWAP – Precision Anchored Like Ice
The Frozen 4H VWAP – Precision Anchored delivers a clean, stable, and reliable view of the 4-hour Volume Weighted Average Price, designed for traders who want higher timeframe insights without intrabar noise or repainting.
🔹 Key Features:
Non-Repainting: VWAP value is “frozen” at the close of each 4H candle — no mid-bar updates or flickering.
4H Timeframe Anchoring: Seamlessly pulls 4-hour VWAP values into any timeframe you’re trading on.
Clear Trend Reference: Updates only when a new 4H candle begins, acting as a trustworthy anchor for support/resistance.
Custom Source Option: Choose from different price sources (default: HLC3) to fit your strategy.
Whether you're scalping, day trading, or swing trading, this indicator gives you a powerful edge by grounding your decisions in higher timeframe VWAP data — clear, calm, and frozen in time.
חפש סקריפטים עבור "support resistance"

Simple Liquidity Zones [Supertrade]🔎 What this indicator does
This indicator is designed to highlight liquidity sweep zones on the chart.
• A liquidity sweep occurs when price briefly breaks above a recent swing high or below a recent swing low, but fails to close beyond it.
• Such behavior often indicates that price has taken liquidity (stop orders resting above highs or below lows) and may reverse.
The indicator marks these events as bullish or bearish liquidity zones:
• Bullish Zone (green) → Price swept a swing low and closed back above it (possible bullish reversal area).
• Bearish Zone (red) → Price swept a swing high and closed back below it (possible bearish reversal area).
These zones are drawn as shaded horizontal bands that extend forward in time, providing visual areas where liquidity grabs occurred.
________________________________________
⚙️ How calculations are made
The indicator does not use moving averages or smoothing.
Instead, it works with raw price action:
1. Swing Detection → It checks the highest high and lowest low of the past N bars (swing length).
2. Sweep Logic →
o A bearish sweep happens if the high breaks above the previous swing high, but the close returns below that level.
o A bullish sweep happens if the low breaks below the previous swing low, but the close returns above that level.
3. Zone Creation → When a sweep is detected, a shaded zone is drawn just above/below the swing level.
4. Persistence → Zones extend into the future until replaced by new ones (or optionally until price fully trades through them).
This makes the calculations simple, transparent, and responsive to actual market structure without lag.
________________________________________
📈 How it helps traders
This tool helps traders by:
• Visualizing liquidity areas → Shows where price previously swept liquidity and may act as support/resistance.
• Identifying reversals → Helps spot potential turning points after liquidity grabs.
• Risk management → Zones highlight areas where stops may be targeted, useful for positioning stop-loss orders.
• Confluence tool → Works best when combined with other strategies such as order blocks, trendlines, or volume analysis.
⚠️ Note: Like all indicators, this should not be used in isolation. It provides context, not guaranteed trade signals.
________________________________________
🏦 Markets & Timeframes
• Works across all markets (crypto, forex, stocks, indices, commodities).
• Particularly effective in high-liquidity environments where stop-hunting is common (e.g., forex majors, BTC/ETH, S&P500).
• Timeframes:
o Lower timeframes (1m–15m) → Scalpers can spot intraday liquidity sweeps.
o Higher timeframes (1H–1D) → Swing traders can identify major liquidity pools.
________________________________________

IFVG by Toño# IFVG by Toño - Pine Script Indicator
## Overview
This Pine Script indicator identifies and visualizes **Fair Value Gaps (FVG)** and **Inverted Fair Value Gaps (IFVG)** on trading charts. It provides advanced analysis of price inefficiencies and their subsequent inversions when mitigated.
## Key Features
### 1. Fair Value Gap (FVG) Detection
- **Bullish FVG**: Detected when `low > high ` (gap between current low and high of 2 bars ago)
- **Bearish FVG**: Detected when `high < low ` (gap between current high and low of 2 bars ago)
- Visual representation using colored rectangles (green for bullish, red for bearish)
### 2. Inverted Fair Value Gap (IFVG) Creation
- **IFVG Formation**: When a FVG gets mitigated (price fills the gap with candle body), an IFVG is created
- **Color Inversion**: The IFVG takes the opposite color of the original FVG
- Mitigated bullish FVG → Creates red (bearish) IFVG
- Mitigated bearish FVG → Creates green (bullish) IFVG
- **Mitigation Logic**: Uses only candle body (not wicks) to determine when a FVG is filled
### 3. Customizable Display Options
- **Show Normal FVG**: Toggle visibility of regular Fair Value Gaps
- **Show IFVG**: Toggle visibility of Inverted Fair Value Gaps
- **Smart FVG Display**: Even when "Show Normal FVG" is disabled, FVGs that are part of IFVGs remain visible
- **Extension Control**: Option to extend FVGs until they are mitigated
### 4. IFVG Extension Methods
- **Full Cross Method**: IFVG remains active until price completely crosses through it (including wicks)
- **Number of Bars Method**: IFVG remains active for a specified number of bars (1-100)
### 5. Visual Mitigation Signals
- **Cross Markers**: Shows X-shaped markers when IFVGs are mitigated
- Green cross above bar: Bearish IFVG mitigated
- Red cross below bar: Bullish IFVG mitigated
### 6. Comprehensive Alert System
- **IFVG Formation Alerts**: Notifications when new IFVGs are created
- **IFVG Mitigation Alerts**: Notifications when IFVGs are filled/mitigated
- **Separate Controls**: Individual toggles for bullish and bearish IFVG alerts
## How It Works
### Step-by-Step Process:
1. **FVG Detection**: Script continuously scans for 3-bar patterns that create price gaps
2. **FVG Tracking**: Each FVG is stored with its coordinates, type, and status
3. **Mitigation Monitoring**: Script watches for candle bodies that fill the FVG
4. **IFVG Creation**: Upon mitigation, creates an IFVG with opposite polarity at the same location
5. **IFVG Management**: Tracks and extends IFVGs according to chosen method
6. **Visual Updates**: Dynamically updates colors and visibility based on user settings
## Use Cases
- **Support/Resistance Analysis**: IFVGs often act as strong support/resistance levels
- **Market Structure Understanding**: Helps identify how market inefficiencies get filled and reversed
- **Entry/Exit Timing**: Can be used to time entries around IFVG formations or mitigations
- **Confluence Analysis**: Combine with other technical analysis tools for stronger signals
## Configuration Parameters
- **Colors**: Customizable colors for bullish/bearish FVGs and IFVGs
- **Extension**: Choose how long to display gaps on the chart
- **Alerts**: Full control over notification preferences
- **Visual Clarity**: Options to show/hide different gap types for cleaner charts
## Technical Specifications
- **Pine Script Version**: 5
- **Overlay**: True (displays directly on price chart)
- **Max Boxes**: 500 (supports up to 500 simultaneous gaps)
- **Performance**: Optimized array management for smooth operation
This indicator is particularly valuable for traders who use **Smart Money Concepts (SMC)** and **Inner Circle Trader (ICT)** methodologies, as it provides clear visualization of how institutional order flow creates and fills market inefficiencies.

BTC Evaluation IndicatorBTC Evaluation Indicator
The BTC Evaluation Indicator is a volatility-based tool designed to help traders evaluate Bitcoin’s price behavior relative to its moving average trend. It combines customizable moving averages with dynamic standard deviation bands to identify overbought and oversold conditions.
Key Features
Flexible Moving Averages: Choose between SMA, EMA, WMA, VWMA, HMA, or RMA for the baseline trend.
Dynamic Volatility Bands: Upper and lower bands are calculated using standard deviation, scaled by a user-defined multiplier.
Visual Clarity:
Orange line = central moving average (trend mean)
Green line = upper band (potential overbought zone)
Red line = lower band (potential oversold zone)
Shaded gray area = volatility range
Automatic Highlights: Background shading marks when price breaks above the upper band (overbought) or below the lower band (oversold).
How to Use
When price pushes above the upper band, it may indicate overextension or potential local overbought conditions.
When price falls below the lower band, it may signal undervaluation or potential oversold conditions.
The mean line acts as a dynamic equilibrium, often serving as short-term support/resistance.
This indicator is designed for Bitcoin evaluation, but it can be applied to any asset. By combining trend analysis with volatility context, it helps traders better understand when price may be stretched and when conditions are reverting to the mean.

Multi-Band Trend LineThis Pine Script creates a versatile technical indicator called "Multi-Band Trend Line" that builds upon the concept of the popular "Follow Line Indicator" by Dreadblitz. While the original Follow Line Indicator uses simple trend detection to place a line at High or Low levels, this enhanced version combines multiple band-based trading strategies with dynamic trend line generation. The indicator supports five different band types and provides more sophisticated buy/sell signals based on price breakouts from various technical analysis bands.
Key Features
Multi-Band Support
The indicator supports five different band types:
- Bollinger Bands: Uses standard deviation to create bands around a moving average
- Keltner Channels: Uses ATR (Average True Range) to create bands around a moving average
- Donchian Channels: Uses the highest high and lowest low over a specified period
- Moving Average Envelopes: Creates bands as a percentage above and below a moving average
- ATR Bands: Uses ATR multiplier to create bands around a moving average
Dynamic Trend Line Generation (Enhanced Follow Line Concept)
- Similar to the Follow Line Indicator, the trend line is placed at High or Low levels based on trend direction
- Key Enhancement: Instead of simple trend detection, this version uses band breakouts to trigger trend changes
- When price breaks above the upper band (bullish signal), the trend line is set to the low (optionally adjusted with ATR) - similar to Follow Line's low placement
- When price breaks below the lower band (bearish signal), the trend line is set to the high (optionally adjusted with ATR) - similar to Follow Line's high placement
- The trend line acts as dynamic support/resistance, following the price action more precisely than the original Follow Line
ATR Filter (Follow Line Enhancement)
- Like the original Follow Line Indicator, an ATR filter can be selected to place the line at a more distance level than the normal mode settled at candles Highs/Lows
- When enabled, it adds/subtracts ATR value to provide more conservative trend line placement
- Helps reduce false signals in volatile markets
- This feature maintains the core philosophy of the Follow Line while adding more precision through band-based triggers
Signal Generation
- Buy Signal: Generated when trend changes from bearish to bullish (trend line starts rising)
- Sell Signal: Generated when trend changes from bullish to bearish (trend line starts falling)
- Signals are displayed as labels on the chart
Visual Elements
- Upper and lower bands are plotted in gray
- Trend line changes color based on direction (green for bullish, red for bearish)
- Background color changes based on trend direction
- Buy/sell signals are marked with labeled shapes
How It Works
Band Calculation: Based on the selected band type, upper and lower boundaries are calculated
Signal Detection: When price closes above the upper band or below the lower band, a breakout signal is generated
Trend Line Update: The trend line is updated based on the breakout direction and previous trend line value
Trend Direction: Determined by comparing current trend line with the previous value
Alert Generation: Buy/sell conditions trigger alerts and visual signals
Use Cases
Enhanced trend following strategies: More precise than basic Follow Line due to band-based triggers
Breakout trading: Multiple band types provide various breakout opportunities
Dynamic support/resistance identification: Combines Follow Line concept with band analysis
Multi-timeframe analysis with different band types: Choose the most suitable band for your timeframe
Reduced false signals: Band confirmation provides better entry/exit points compared to simple trend following

Session Pivots + EMA20/50 + Bollinger BandsMulti-tool indicator combining session pivots, EMA trend filters, Bollinger Bands, and alerts for intraday trading.
📌 Description
One of the biggest advantages of this indicator is that it supports TradingView’s ALERT system, so traders can be notified the moment price crosses the daily/session pivot level. This allows faster decision-making without constant chart watching.
This script combines three powerful tools into a single indicator:
Session Pivot Levels (with Support/Resistance): Automatically calculates pivot, R1–R3 and S1–S3 levels based on the previous trading session (London, New York, Asia, or custom). Levels are plotted with clean labels and connector lines so you always see the exact price values ahead of time.
EMA Trend Filters (20 & 50): Tracks short- and medium-term market direction with two popular exponential moving averages, helping confirm entries and exits.
Bollinger Bands (fully customizable): Adds volatility bands with choice of SMA, EMA, SMMA, WMA, or VWMA for the middle line, plus adjustable standard deviation and offset.
✅ Key Features
Auto-detects London, New York, and Asian sessions or set your own custom session.
Displays up to 3 levels of support and resistance from the previous session.
Clean label display with customizable theme options (Dark, Light, Custom).
Alerts included: Get notified instantly when price crosses above or below the Pivot.
EMA20/50 trend confirmation built-in.
Bollinger Bands with multiple moving average types and volatility settings.
Works for Forex, Crypto, Indices, Commodities — optimized for intraday & scalping.
This makes it a complete intraday toolkit, reducing the need to load multiple separate indicators.
📄 Full documentation available here: [ link ]

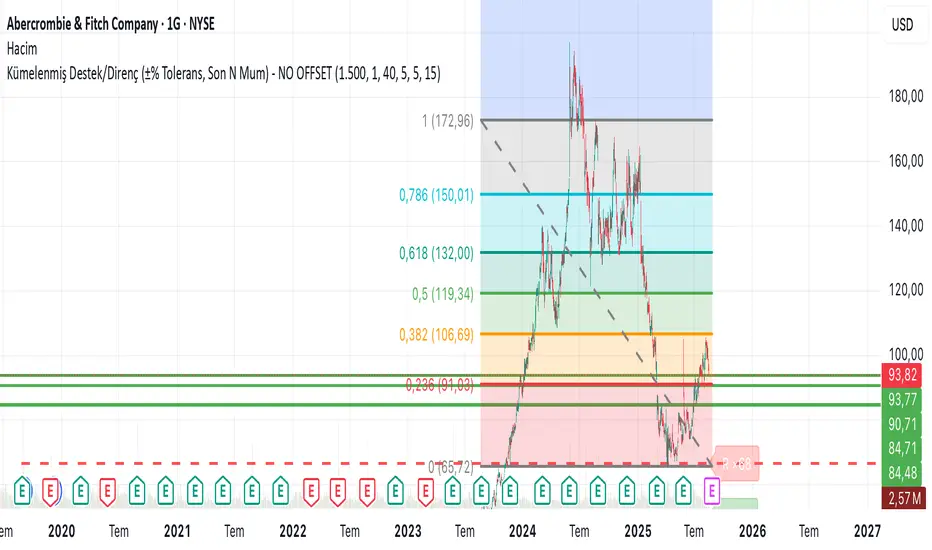
Clustered Support/Resistance (±% Tolerance, Last N Bars) – NO OFIn the last 1500 candles (user-adjustable), pivot highs and lows are clustered. If more than 20 touches occur within a ±1% tolerance zone, that level is marked as a support or resistance line.
The following parameters are configurable:
Tolerance (%)
Minimum touch count
Pivot left/right length
Maximum number of lines
This allows flexible identification of significant support and resistance zones based on repeated pivot clustering within the chosen lookback period.
Volume Profile Grid [Alpha Extract]A sophisticated volume distribution analysis system that transforms market activity into institutional-grade visual profiles, revealing hidden support/resistance zones and market participant behavior. Utilizing advanced price level segmentation, bullish/bearish volume separation, and dynamic range analysis, the Volume Profile Grid delivers comprehensive market structure insights with Point of Control (POC) identification, Value Area boundaries, and volume delta analysis. The system features intelligent visualization modes, real-time sentiment analysis, and flexible range selection to provide traders with clear, actionable volume-based market context.
🔶 Dynamic Range Analysis Engine
Implements dual-mode range selection with visible chart analysis and fixed period lookback, automatically adjusting to current market view or analyzing specified historical periods. The system intelligently calculates optimal bar counts while maintaining performance through configurable maximum limits, ensuring responsive profile generation across all timeframes with institutional-grade precision.
// Dynamic period calculation with intelligent caching
get_analysis_period() =>
if i_use_visible_range
chart_start_time = chart.left_visible_bar_time
current_time = last_bar_time
time_span = current_time - chart_start_time
tf_seconds = timeframe.in_seconds()
estimated_bars = time_span / (tf_seconds * 1000)
range_bars = math.floor(estimated_bars)
final_bars = math.min(range_bars, i_max_visible_bars)
math.max(final_bars, 50) // Minimum threshold
else
math.max(i_periods, 50)
🔶 Advanced Bull/Bear Volume Separation
Employs sophisticated candle classification algorithms to separate bullish and bearish volume at each price level, with weighted distribution based on bar intersection ratios. The system analyzes open/close relationships to determine volume direction, applying proportional allocation for doji patterns and ensuring accurate representation of buying versus selling pressure across the entire price spectrum.
🔶 Multi-Mode Volume Visualization
Features three distinct display modes for bull/bear volume representation: Split mode creates mirrored profiles from a central axis, Side by Side mode displays sequential bull/bear segments, and Stacked mode separates volumes vertically. Each mode offers unique insights into market participant behavior with customizable width, thickness, and color parameters for optimal visual clarity.
// Bull/Bear volume calculation with weighted distribution
for bar_offset = 0 to actual_periods - 1
bar_high = high
bar_low = low
bar_volume = volume
// Calculate intersection weight
weight = math.min(bar_high, next_level) - math.max(bar_low, current_level)
weight := weight / (bar_high - bar_low)
weighted_volume = bar_volume * weight
// Classify volume direction
if bar_close > bar_open
level_bull_volume += weighted_volume
else if bar_close < bar_open
level_bear_volume += weighted_volume
else // Doji handling
level_bull_volume += weighted_volume * 0.5
level_bear_volume += weighted_volume * 0.5
🔶 Point of Control & Value Area Detection
Implements institutional-standard POC identification by locating the price level with maximum volume accumulation, providing critical support/resistance zones. The Value Area calculation uses sophisticated sorting algorithms to identify the price range containing 70% of trading volume, revealing the market's accepted value zone where institutional participants concentrate their activity.
🔶 Volume Delta Analysis System
Incorporates real-time volume delta calculation with configurable dominance thresholds to identify significant bull/bear imbalances. The system visually highlights price levels where buying or selling pressure exceeds threshold percentages, providing immediate insight into directional volume flow and potential reversal zones through color-coded delta indicators.
// Value Area calculation using 70% volume accumulation
total_volume_sum = array.sum(total_volumes)
target_volume = total_volume_sum * 0.70
// Sort volumes to find highest activity zones
for i = 0 to array.size(sorted_volumes) - 2
for j = i + 1 to array.size(sorted_volumes) - 1
if array.get(sorted_volumes, j) > array.get(sorted_volumes, i)
// Swap and track indices for value area boundaries
// Accumulate until 70% threshold reached
for i = 0 to array.size(sorted_indices) - 1
accumulated_volume += vol
array.push(va_levels, array.get(volume_levels, idx))
if accumulated_volume >= target_volume
break
❓How It Works
🔶 Weighted Volume Distribution
Implements proportional volume allocation based on the percentage of each bar that intersects with price levels. When a bar spans multiple levels, volume is distributed proportionally based on the intersection ratio, ensuring precise representation of trading activity across the entire price spectrum without double-counting or volume loss.
🔶 Real-Time Profile Generation
Profiles regenerate on each bar close when in visible range mode, automatically adapting to chart zoom and scroll actions. The system maintains optimal performance through intelligent caching mechanisms and selective line updates, ensuring smooth operation even with maximum resolution settings and extended analysis periods.
🔶 Market Sentiment Analysis
Features comprehensive volume analysis table displaying total volume metrics, bullish/bearish percentages, and overall market sentiment classification. The system calculates volume dominance ratios in real-time, providing immediate insight into whether buyers or sellers control the current price structure with percentage-based sentiment thresholds.
🔶 Visual Profile Mapping
Provides multi-layered visual feedback through colored volume bars, POC line highlighting, Value Area boundaries, and optional delta indicators. The system supports profile mirroring for alternative perspectives, line extension for future reference, and customizable label positioning with detailed price information at critical levels.
Why Choose Volume Profile Grid
The Volume Profile Grid represents the evolution of volume analysis tools, combining traditional volume profile concepts with modern visualization techniques and intelligent analysis algorithms. By integrating dynamic range selection, sophisticated bull/bear separation, and multi-mode visualization with POC/Value Area detection, it provides traders with institutional-quality market structure analysis that adapts to any trading style. The comprehensive delta analysis and sentiment monitoring system eliminates guesswork while the flexible visualization options ensure optimal clarity across all market conditions, making it an essential tool for traders seeking to understand true market dynamics through volume-based price discovery.

SONIC R BREAK FINAL (VER5)
Purpose: Capture breakouts through Support/Resistance (S/R) zones based on Pivot and filter signals using EMA 34 (High/Low/Close), EMA 89, volume, and candle structure. Includes a Higher Timeframe (H4) RSI risk warning (visual only, does not block entries).
How it works
S/R zones from Pivot
Draws Resistance and Support using ta.pivothigh/ta.pivotlow with Left/Right Bars.
S/R lines are locked with offset to reduce repaint.
EMA trend filters
EMA34 High/Low/Close build a “EMA 34 band”.
EMA89 works as the main trend filter.
Trend conditions:
Long: close above all EMA34 High/Low/Close and EMA89.
Short: close below all EMA34 High/Low/Close and EMA89.
Volume filter (optional)
Signal valid only if Volume > SMA(Volume, n).
Wick filter
Each wick (upper/lower) ≤ 50% of candle range to avoid weak breakouts.
Higher TF RSI risk (H4)
Fetches RSI from a higher timeframe (default H4).
If RSI exceeds threshold, breakout labels turn gray (risk warning only).
Anti-repeat mechanism
Each new pivot resets trigger.
Each S/R level triggers only once until the next pivot is formed.
Signals & Alerts
Label “B” (green) below candle: breakout above Resistance, valid EMA/Volume/Wick conditions.
Label “S” (red) above candle: breakout below Support, valid EMA/Volume/Wick conditions.
Gray labels = H4 RSI risk warning.
Unified alert: “S/R Breakout (Unified)” with message B=Buy, S=Sell, Gray=Risk.
Parameters
Show Breaks: toggle breakout detection.
Left/Right Bars: pivot sensitivity.
Require Volume > Average + Volume MA Length: volume filter.
Use H4 RSI Risk Warning: enable higher TF RSI check.
RSI Length, Higher TF (minutes), RSI thresholds for Buy/Sell risk.
Usage tips
Prioritize trades in the same direction as EMA89 and EMA34 trend.
Works on M5 to H4; best combined with RSI H4 when trading M15/M30.
Place SL behind the S/R just broken, TP by fixed RR or EMA trailing.
Increase Left/Right Bars for stronger zones and less noise in sideways markets.
Notes
Pivot still has repaint element (mitigated by offset).
This indicator is not financial advice. Always combine with proper risk management.
Version
Clean v4: added wick ≤50% filter, H4 RSI risk coloring, volume filter, anti-repeat pivot trigger, unified alert, EMA34 H/L/C background shading.
Linh Index Trend & Exhaustion SuitePurpose: One overlay to judge trend, reversal risk, overextension, and volatility squeezes on indexes (built for VNINDEX/VN30, works on any symbol & timeframe).
What it shows
Trend state: Bull / Bear / Transition via 20/50/200 EMAs + slope check.
Overextension heatmap: Background paints when price is stretched vs the 20-EMA by ATR or % (you set the thresholds).
Squeeze detection:
Squeeze ON (yellow dot): Bollinger Bands (20,2) inside Keltner Channels (20,1.5).
Squeeze OFF + Release: White dot; script confirms direction only when close > BB upper (up) or close < BB lower (down).
52-week context: Distance to 52-week high/low (%).
Higher-TF alignment: Optional weekly trend reading shown on the label while you’re on the daily.
Anchored VWAP(s): Two optional AVWAPs from dates you choose (e.g., YTD open, last big gap/earnings).
Plots & labels
EMAs 20/50/200 (toggle on/off).
Optional BB & KC bands for diagnostics.
AVWAP #1 / #2 (optional).
Status label with: Trend, EMAs, Dist to 20-EMA (%, ATR), 52-week distances, HTF state.
Built-in alerts (set “Once per bar close”)
EMA10 ↔ EMA20 cross (early momentum shift)
EMA20 ↔ EMA50 cross (trend confirmation/negation)
Price ↔ EMA200 cross (long-term regime)
Squeeze Release UP / DOWN (BB breakout after squeeze)
Overextension Cool-off UP / DN (stretched vs 20-EMA + momentum rolling)
Near 52-week High (within your % threshold)
How to use (playbook)
Map regime: Prefer trades when Daily = Bull and HTF (Weekly) = Bull (shown on label).
Hunt expansion: Yellow → White dot and close beyond BB = fresh move.
Avoid chasing stretch: If background is painted (overextended vs 20-EMA), wait for a pullback or intraday base.
Locations matter: 52-week proximity + HTF Bull improves breakout quality.
Anchors: Add AVWAP from YTD open or last major gap to frame support/resistance.
Suggested settings
Overextension: ATR = 2.0, % = 4.0 to start; tune per index volatility.
Squeeze bands: BB(20,2) & KC(20,1.5) default are balanced; tighten KC (1.3) for more signals, widen (1.8) for fewer/higher quality.
Timeframes: Daily for signals, Weekly for bias. Optional 65-min for entries.

Stochastic MACDStochastic MACD Indicator: Quick Guide
This Pine Script indicator, "Stochastic MACD" (SMACD), blends MACD and Stochastic Oscillator principles to help you spot momentum shifts and potential reversals.
What it Shows:
SMACD Line: Tracks momentum.
Signal Line: Averages the SMACD line, creating crossovers.
Histogram: Visualizes momentum strength, changing color with direction.
Overbought/Oversold Levels: (Default 10 and -10) Help identify stretched market conditions. Adjustable in settings.
Visual Signals (Triangles):
Red Down Arrow (Overbought Signal): Appears when both SMACD and Signal lines are above the Overbought level (default 10) AND SMACD crosses the Signal line upwards. This suggests strong overbought conditions and a potential reversal down.
Green Up Arrow (Oversold Signal): Appears when both SMACD and Signal lines are below the Oversold level (default -10) AND SMACD crosses the Signal line upwards. This suggests potential buying opportunities from oversold conditions and a possible reversal up.
How to Use It:
Confirm Trends: Use the histogram and line directions.
Spot Reversals: Look for the red and green triangles for quick alerts.
Combine: Always use with other analysis like price action or support/resistance.
Important: This is an analytical tool, not financial advice. Trading involves risk.

Mig Trade Model - Kill Zones
Key features:
Liquidity Hunt Detection: Spots aggressive moves that "hunt" stops beyond recent swing highs/lows.
Consolidation Filter: Requires 1-3 small-range candles after a hunt before confirming with a strong candle.
Bias Application: Uses daily open/close to auto-detect bias or allows manual override.
Kill Zone Restriction: Limits signals to London (default: 7-10 AM UTC) and NY (default: 12-3 PM UTC) sessions for better relevance in active markets.
This strategy is inspired by smart money concepts (SMC) and ICT (Inner Circle Trader) methodologies, aiming to capture venom-like "stings" in price action where liquidity is grabbed before reversals.
How It Works
ATR Calculation: Uses a user-defined ATR length (default: 14) to measure volatility, which scales candle body and range thresholds.
Bias Determination:
Auto: Compares daily close to open (bullish if close > open).
Manual: User selects "Bullish" or "Bearish."
Strong Candles:
Bullish: Green candle with body > 2x ATR (configurable).
Bearish: Red candle with body > 2x ATR.
Small Range Candles:
Candles where high-low < 0.5x ATR (configurable).
Liquidity Hunt:
Bullish Hunt: Strong bearish candle making a new low below the past swing low (default: 10 bars).
Bearish Hunt: Strong bullish candle making a new high above the past swing high.
Signal Generation:
After a hunt, counts 1-3 small-range candles.
Confirms with a strong candle in the opposite direction (e.g., strong bullish after bearish hunt).
Resets if >3 small candles or an opposing strong candle appears.
Kill Zone Filter:
Checks if the current bar's time (in UTC) falls within London or NY Kill Zones.
Only allows final "Buy" (bullish entry) or "Sell" (bearish entry) if bias matches and in Kill Zone.
Plots:
Yellow circle (below): Bullish liquidity hunt.
Orange circle (above): Bearish liquidity hunt.
Blue diamond (below): Raw bullish signal.
Purple diamond (above): Raw bearish signal.
Green triangle up ("Buy"): Filtered bullish entry.
Red triangle down ("Sell"): Filtered bearish entry.
Inputs
Bias: "Auto" (default), "Bullish", or "Bearish" – Controls signal direction based on daily trend.
ATR Length: 14 (default) – Period for ATR calculation.
Swing Length for Liquidity Hunt: 10 (default) – Bars to look back for swing highs/lows.
Strong Candle Body Multiplier (x ATR): 2.0 (default) – Threshold for strong candle bodies.
Small Range Multiplier (x ATR): 0.5 (default) – Threshold for small-range candles.
London Kill Zone Start/End Hour (UTC): 7/10 (default) – Customize London session hours.
NY Kill Zone Start/End Hour (UTC): 12/15 (default) – Customize New York session hours.
Usage Tips
Timeframe: Best on lower timeframes (e.g., 5-15 min) for intraday trading, especially forex pairs like EURUSD or GBPUSD.
Timezone Adjustment: Inputs are in UTC. If your chart is in a different timezone (e.g., EST = UTC-5), adjust hours accordingly (e.g., London: 2-5 AM EST → 7-10 UTC).
Risk Management: Use with stop-loss (e.g., beyond the hunt low/high) and take-profit based on ATR multiples. Not financial advice—backtest thoroughly.
Customization: Tweak multipliers for different assets; higher for volatile cryptos, lower for stocks.
Limitations: Relies on historical data; may generate false signals in ranging markets. Combine with other indicators like volume or support/resistance.
This indicator is for educational purposes. Always use discretion and proper risk management in live trading. If you find it useful, feel free to share feedback or suggestions!

Previous VWAP Levels by Riotwolftrading The "Previous VWAP" indicator calculates and displays the previous session's Volume Weighted Average Price (VWAP) for five timeframes (Daily, Weekly, Monthly, Quarterly, Yearly).
Each VWAP is plotted as a horizontal line extending to the right edge of the chart, with customizable labels at the right to identify each level. The indicator is designed for traders who want to visualize key price levels from prior periods without cluttering the chart with current VWAPs or additional metrics like standard deviations.
**Functionality**:
- **Calculates Previous VWAPs**: Computes the VWAP for the previous session of each timeframe (Daily, Weekly, Monthly, Quarterly, Yearly) based on the input source (default: `hlc3`) and volume.
- **Visual Style** : Uses `line.new` to draw horizontal lines from five bars back to the current bar, ensuring the lines extend to the right edge of the chart. Labels are placed at the right edge using `label.new` for clear identification.
- **Customization** : Allows users to toggle visibility, adjust line styles, widths, colors, and label sizes, and choose between abbreviated or full label text.
- **Minimalist Design**: Focuses solely on previous VWAPs, omitting current VWAPs, rolling VWAPs, and standard deviation bands to keep the chart clean.
**Intended Use**: This indicator is useful for traders who rely on historical VWAP levels as support/resistance or reference points for trading decisions, particularly in strategies involving mean reversion or breakout trading.
---
### Rules and Features
*VWAP Calculation**:
- The VWAP is calculated as the cumulative sum of price (`src`) multiplied by volume (`sumSrcVol`) divided by the cumulative volume (`sumVol`) for each timeframe.
- The "previous VWAP" is the VWAP value from the prior session, captured when a new session begins (e.g., new day, week, month, etc.).
- The indicator uses the `hlc3` (average of high, low, close) as the default source, but users can modify this in the settings.
**Timeframes**:
- **Daily**: Previous day's VWAP.
- **Weekly**: Previous week's VWAP.
- **Monthly**: Previous month's VWAP.
- **Quarterly**: Previous quarter's VWAP (3 months).
- **Yearly**: Previous year's VWAP (12 months).
- New sessions are detected using `ta.change(time(period))` for each timeframe.
**Line Drawing**:
- Lines are drawn using `line.new` from `time ` (five bars back) to the current bar (`time`), ensuring they extend to the right edge of the chart.
- Lines are updated only on the last confirmed bar (`barstate.islast`) to optimize performance and avoid repainting.
- Previous lines are deleted (`line.delete`) to prevent overlapping or clutter.
**Labels**:
- Labels are drawn at the right edge (`x=time`, `xloc=xloc.bar_time`) with `label.new`.
- Users can choose between abbreviated labels (e.g., "pvD" for Previous Daily VWAP) or full labels (e.g., "Prev Daily VWAP").
- Label sizes are customizable (`tiny`, `small`, `normal`, `large`, `huge`).
- Labels are deleted (`label.delete`) on each update to maintain a clean chart.
5. **Customization Options**:
- **Visibility**: Toggle each VWAP (Daily, Weekly, Monthly, Quarterly, Yearly) on or off.
- **Colors**: Individual color settings for each VWAP line and label (default colors: Daily=#E12D7B, Weekly=#F67B52, Monthly=#EDCD3B, Quarterly=#3BBC54, Yearly=#2665BD).
- **Line Style**: Choose from `solid`, `dotted`, or `dashed` lines.
- **Line Width**: Adjustable from 1 to 4 pixels.
- **Label Settings**: Enable/disable labels, abbreviate text, and select label size.
- **Source**: Customize the price source (default: `hlc3`).
**Performance Optimization**:
- The indicator only updates lines and labels on the last confirmed bar to minimize computational overhead.
- Uses `var` to initialize variables and avoid unnecessary recalculations.
- Deletes previous lines and labels to prevent chart clutter.
---
### Usage Instructions
1. **Add to Chart**:
- In TradingView, go to the Pine Editor, paste the script, and click "Add to Chart."
- The indicator will overlay on the price chart, showing previous VWAP lines and labels.
2. **Configure Settings**:
- Open the indicator settings to customize:
- Toggle visibility of each VWAP timeframe.
- Adjust colors, line style, and width.
- Enable/disable labels, choose abbreviation, and set label size.
- Modify the source if needed (e.g., use `close` instead of `hlc3`).
3. **Interpretation**:
- **Previous VWAPs**: Act as dynamic support/resistance levels based on the prior session's volume-weighted price.
- **Timeframes**: Use shorter timeframes (Daily, Weekly) for intraday/swing trading, and longer timeframes (Monthly, Quarterly, Yearly) for positional trading.
- **Labels**: Identify each VWAP level at the right edge of the chart for quick reference.
4. **Best Practices**:
- Use on charts with sufficient volume data, as VWAP relies on volume (a warning is triggered if no volume data is available).
- Combine with other indicators (e.g., moving averages, RSI) for confirmation in trading strategies.
- Adjust line styles and colors to avoid visual overlap with other chart elements.
---
### Example Use Case
A trader using a 1-hour chart can add the "Previous VWAP" indicator to identify key levels from the prior day, week, or month. For example:
- The Previous Daily VWAP might act as a support level for a bullish trend.
- The Previous Weekly VWAP could serve as a target for a swing trade.
- Labels at the right edge make it easy to identify these levels without cluttering the chart.
This indicator provides a clean, customizable way to visualize previous VWAPs, making it ideal for traders who want historical price context with minimal chart noise. For the complete Pine Script code, refer to the artifact provided in the previous response.

HF Crypto Scalping BotHigh-Frequency Crypto Scalping Bot for ETHUSDT
This bot is designed for scalping ETHUSDT on a 1-minute chart using a blend of technical indicators and market structure logic.
🔍 Strategy Highlights:
Range Mode: Uses RSI and MFI to identify overbought/oversold zones near support/resistance.
Trend Mode: Detects MACD momentum combined with confirmed S/R breakouts.
Smart Risk Management: Dynamic stop loss and take profit based on risk:reward ratio.
Adaptive Market Logic: Automatically switches between trend and range conditions.
Real-Time Table: Displays RSI, MFI, MACD trend, market mode, entry/exit prices, and stop/target levels.
Visual Cues: Buy/Sell/Exit signals plotted directly on the chart with color-coded levels.
Alerts: Integrated long/short entry and exit alerts with live price and indicator values.
Customize the input parameters to fit your risk profile and asset volatility. Ideal for fast-paced scalping with dynamic conditions.

Market Structure Dashboard @darshakssc📌 Market Structure Dashboard by @darshakssc is a comprehensive visual analysis tool designed to assist traders and analysts in understanding market conditions by presenting multiple key technical insights in one place.
This script does not provide buy or sell signals, but helps you interpret essential elements of market behavior — such as structure shifts, momentum conditions, trend direction, and volatility — for informed decision-making.
🔍 What This Dashboard Displays:
✅ Market Phase Detection
Identifies the current market condition as Bullish, Bearish, Accumulation, or Distribution, based on trend logic and RSI thresholds.
✅ Trend Direction (EMA-Based)
Uses customizable Fast and Slow Exponential Moving Averages (EMAs) to evaluate whether the market is trending upward or downward.
✅ Key Support & Resistance Levels
Highlights potential support and resistance areas based on structural highs and lows and pivot logic.
✅ RSI Momentum State
Tracks whether momentum is Overbought, Oversold, or Neutral, using the classic RSI indicator.
✅ Volatility Overview
Detects high or low volatility zones using ATR (Average True Range) compared to a moving average baseline.
✅ Structure Shift Markers
Displays triangle markers on the chart when a structural trend shift is detected.
✅ Custom Themes and Design
Choose between three clean themes — Classic, Modern, and Dark — for enhanced readability and aesthetics.
📊 Visual Elements
1). An intuitive table-style dashboard appears in the top-right of the chart.
2). Colored EMA overlays and plotted support/resistance circles on the price chart.
3). Structure shift indicators help visually mark potential change zones.
⚠️ Important Notice:
This tool is intended for educational and informational purposes only. It does not provide financial advice, trade recommendations, or guaranteed outcomes. Always use your own discretion and analysis, and consult a qualified financial professional before making investment decisions.
Trading involves risk and past performance does not guarantee future results.

Advanced Trend Panel v3.1This is a comprehensive dashboard indicator designed to give traders a multi-faceted view of the market at a single glance. It combines key indicators across multiple timeframes, calculates trend duration, and presents all information in a clean, color-coded table. This tool is perfect for confirming trade ideas, identifying trend alignment, and understanding the underlying market dynamics.
#### Key Features:
* **All-in-One Dashboard:** A convenient on-chart table summarizes the state of multiple key indicators, saving you screen space and time.
* **Multi-Timeframe (MTF) Forecast:** Analyzes the long-term trend on a higher timeframe (e.g., Daily) to provide context for the current chart's trend.
* **Trend Analysis:** Uses dual sets of EMAs (long-term and short-term) to define the primary and immediate trend directions.
* **Trend Duration:** A unique feature that calculates how long the current short-term and long-term trends have been active, helping you gauge trend maturity.
* **Core Indicators Included:**
* **ADX:** Measures trend strength to differentiate between strong trends and weak or sideways markets.
* **RSI:** Identifies overbought and oversold conditions.
* **Point of Control (POC):** Shows the price level with the highest traded volume over a lookback period, acting as a key level of support/resistance.
* **Volume:** Compares current volume to its moving average to spot unusual activity.
* **Customizable Alerts:** Set up alerts for trend changes (long-term or short-term), RSI crossing into overbought/oversold zones, or shifts in ADX trend strength.
#### How to Use:
1. Apply the indicator to your chart.
2. In the settings, configure the timeframes, indicator lengths, and display options to match your trading style.
3. Use the table to quickly assess if the long-term trend, short-term trend, and momentum are aligned.
4. Enable alerts to be notified of key changes in market conditions without having to watch the chart constantly.
**Disclaimer:** This script is for educational purposes only and should not be considered financial advice. All trading involves risk. Past performance is not indicative of future results. Please backtest and use this tool as part of a comprehensive trading plan with proper risk management.
Feedback is always welcome! If you find this indicator useful, please leave a like.

Breakout + Retest StrategyThe Breakout + Retest Strategy is a proven price action approach used by professional traders to catch high-probability market moves after key levels are broken. This strategy aims to enter the market after confirmation — reducing false breakouts and improving entry accuracy.
🔍 Strategy Logic:
Identify a Key Support or Resistance Level
These could be recent swing highs/lows, consolidation zones, or session highs.
Wait for a Clean Breakout
Price must decisively break above resistance or below support with strong momentum.
Watch for the Retest
After the breakout, wait for the price to pull back to the broken level (now flipped support/resistance).
Enter on Retest Confirmation
Look for signs like rejection wicks, bullish/bearish engulfing candles, or strong volume on the retest.
Set Risk-Managed Stops and Targets
Stop loss goes below (for long) or above (for short) the retested level.
Target is usually set at a 1:2 or higher risk-to-reward ratio, or based on structure.
✅ Why It Works:
Filters out fake breakouts
Uses market structure and liquidity traps to your advantage
Combines both momentum and confirmation
⚙️ Best Timeframes:
15-minute to 1-hour for intraday setups
4-hour and daily for swing trades
📊 Ideal for:
Futures (NQ, ES, Gold)
Forex pairs
Crypto
Stocks near key earnings or breakout zones

Intraday Momentum StrategyExplanation of the StrategyIndicators:Fast and Slow EMA: A crossover of the 9-period EMA over the 21-period EMA signals a bullish trend (long entry), while a crossunder signals a bearish trend (short entry).
RSI: Ensures entries are not in overbought (RSI > 70) or oversold (RSI < 30) conditions to avoid reversals.
VWAP: Acts as a dynamic support/resistance. Long entries require the price to be above VWAP, and short entries require it to be below.
Trading Session:The strategy only trades during a user-defined session (e.g., 9:30 AM to 3:45 PM, typical for US markets).
All positions are closed at the session end to avoid overnight risk.
Risk Management:Stop Loss: 1% below/above the entry price for long/short positions.
Take Profit: 2% above/below the entry price for long/short positions.
These can be adjusted via inputs for optimization.
Position Sizing:Fixed lot size of 1 for simplicity. Adjust based on your account size during backtesting.

RSS-Stochastik [afterworktrading]Hi all,
this is the first script from the series "afterworktrading". The goal is to develop and provide tools for traders with a fulltime job or little time for trading/analyzing charts.
Over time some of the scripts will also be linked to complete trading systems.
Let's start with my favourite one, the "RSS-Stochastik" with alert function.
The RSS-concept (Relative Spread Strength, developed by Ian Copsey) is based on the variance between a "short" and a "long" moving averages (or "slow" and "fast"), here between two EMA.
This variance is calculated and plotted in a RSI-diagram to show "overbought" and "oversold" conditions, helping to identify an ideal entry setup for trend continuation or catching a possible reversal.
Compared to the conventional RSI etc., possible reversal or trend continuation areas are often better represented in terms of quality, as an example see the Amazon-Chart.
The EMA-values, limit value thresholds and background colors can be set in the script. As a special feature, alarms can be set to be notified when a value has reached the extreme range. This reduces the screen time to the minimum.
In my personal trading, this indicator forms the basis for almost all trades, but is not a pure signal indicator on its own.
However, the informative value can be further improved if volume or support/resistance zones etc. are linked to the RSS, see example NASDAQ future with support zone price or 200 EMA.
Example for a possible RSS-Trade-Setup:
- choose an asset with a strong trend
- set alerts for crossing the oversold or overbought condition in direction of the trend
- in case of an alert check possible support/resistance areas on the current chart level (EMA, price zones, volume zones, anchored VWAP etc.)
- trade in the direction of the trend using your preferred entry setup
In my opinion, the system can be used very well, especially in trend phases, in order to obtain optimal entries.
Does it works also on lower timeframes?
Yes, it might work on every timeframe with a strong trend of high quality. Please see attached a 5m-Chart of GPBUSD-pair, notice the signal quality in direction of the trend.
Like every trading system this is not the "holy grail setup" and you will have losing trades. But handling this indicator with care you can have better entries especially in trend direction with less screen time due to the alert function.
Good luck with it! Further indicators will be published in the coming months, some will also be based on the RSS system.
As always: no liability for losing trades, no investment advice etc. Observe the risk limit for every trade!

BARTRADINGPREDV4Please note, that all of the indicators on the chart are working together. I am showing all of the indicators so that you might see the benefits of these indicators working as one. Do your own research. Trade smart. I code tools not advice. So please make decisions based on your trading style and knowledge. Use my scripts freely but please note they are protected by Mozilla.
Script Summary: BARTRADINGPREDV4
This Pine Script indicator is a comprehensive trading tool that overlays on your TradingView chart. It combines moving averages, regression channels, volume analysis, RSI filtering, and pattern recognition to assist in making trading decisions. It also provides a forward-looking projection to help anticipate future price movement.
Key Features & Logic
1. Moving Averages
HMA (High Moving Average): Simple moving average of the high price over a user-defined lookback period.
LMA (Low Moving Average): Simple moving average of the low price over the same period.
HLMA (High-Low Moving Average): The average of HMA and LMA, providing a midline reference.
2. RSI Filtering
Optionally enables a Relative Strength Index (RSI) filter to help avoid trades when the market is not trending strongly.
Only allows buy signals if RSI is above 50, and sell signals if RSI is below 50 (if enabled).
3. Signal Generation
BUY Signal: Triggered when HL2 (average of OHLC) crosses over LMA and (optionally) RSI > 50.
SELL Signal: Triggered when HL2 crosses under HMA and (optionally) RSI < 50.
XSB (Extra Strong Buy): HL2 crosses over HMA, is above HLMA, up volume is greater than down volume, and (optionally) RSI > 50.
XBS (Extra Strong Sell): HL2 crosses under LMA, is below HLMA, down volume is greater than up volume, and (optionally) RSI < 50.
Enable/Disable XSB/XBS: You can turn these signals on or off via script inputs.
4. Take Profit (TP) and Stop Loss (SL) Levels
TP and SL are dynamically calculated based on the difference between HMA and LMA, providing contextually relevant exit levels.
5. Regression Channel and Prediction
Linear Regression Line: Plots a regression line over the lookback period to show the underlying trend.
ATR Channel: Adds an upper and lower channel around the regression line using ATR (Average True Range) for a realistic prediction envelope.
Forward Projection: Projects the regression line forward by a user-defined number of bars, visually showing where the trend could extend if current momentum persists.
6. Pattern Recognition
Higher Highs/Lows and Lower Highs/Lows: Marks bars where new higher highs/lows or lower highs/lows are set, helping you spot trend continuation or reversal points.
7. Status Table
A table shows the current price’s relationship to HMA, HLMA, and LMA, color-coded for quick visual interpretation.
User Instructions
Inputs
Number of Lookback Bars: Sets the period for all moving averages and regression calculations.
Prediction Length: (Legacy; not used in current logic.)
TURN ON OR OFF XSB/XBS Signal: Toggle extra strong buy/sell signals.
Enable RSI Filter: Only allow signals when RSI is in the correct zone.
RSI Period: Sets the sensitivity of the RSI filter.
Table Position: Choose where the status table appears on your chart.
ATR Length & Multiplier: Control the width of the regression prediction channel.
Bars Forward (Projection): Number of bars to project the regression line into the future.
How to Use
Add the script to your TradingView chart.
Adjust inputs to suit your asset and timeframe.
Interpret signals:
BUY (B) and SELL (S): Appear as green/red labels below/above bars.
XSB (blue) and XBS (orange): Indicate extra strong buy/sell conditions.
HH/HL (green triangles): New higher highs/lows.
LH/LL (red triangles): New lower highs/lows.
Watch the regression channel: The yellow regression line shows the trend; the shaded band indicates expected volatility.
Check the projection: The dashed magenta line projects the regression trend forward, giving a visual target for price continuation.
Use the table: Quickly see if price is above or below each moving average.
Interpreting the Prediction Aspects
Regression Line & Channel
Regression Line (Yellow): Represents the best-fit line of price over the lookback period, showing overall trend direction.
ATR Channel: The upper and lower bands (yellow, semi-transparent) account for typical volatility, suggesting a range where price is likely to stay if the trend continues.
Forward Projection
Dashed Magenta Line: Projects the regression line forward by the specified number of bars, using the current slope. This is a trend continuation forecast—not a guarantee, but a statistically reasonable path if current conditions persist.
How to use: If price is respecting the regression trend and within the channel, the projection provides a visual target for where price might go in the near future.
TP/SL Levels
TP (Take Profit): Suggests a price target above the current HL2, based on recent volatility.
SL (Stop Loss): Suggests a protective stop below HL2.
Best Practices & Warnings
No indicator is perfect! Always combine signals with your own analysis and risk management.
Regression projection is not a crystal ball: It simply extends the current trend, which can and will change, especially after big news or at support/resistance.
Use on liquid, trending assets for best results.
Adjust lookback and ATR settings for your market and timeframe.
Summary Table Example
Price vs HMA vs HLMA vs LMA
43000 +100 +50 -20
Green: Price is above average (bullish).
Red: Price is below average (bearish).
Yellow: Price is very close to the average (neutral).
Final Notes
This script is designed to be a multi-tool for trend trading and prediction, combining classic and modern techniques. The forward projection helps visualize possible future price action, while signals and overlays keep you informed of trend shifts and trade opportunities.

Williams FractalsBoaBias Fractals High & Lows is an indicator based on Bill Williams' fractals that helps identify key support and resistance levels on the chart. It displays horizontal lines at fractal highs (red) and lows (green), which extend to the current bar. Lines automatically disappear if the price breaks through them, leaving only the relevant levels. Additionally, the indicator shows the price values of active fractals on the price scale for convenient monitoring.
Key Features:
Customizable Fractals: Choose between 3-bar or 5-bar fractals (default: 3-bar).
Period: Adjust the number of periods for calculation
Visualization: Red lines for highs (resistance), green for lows (support). Lines are fixed on the chart and persist during scrolling or scaling changes.
Alert System: Notifications for the formation of a new fractal high/low and for level breaks (Fractal High Formed, Fractal Low Formed, Fractal High Broken, Fractal Low Broken).
How to Use:
Add the indicator to the chart.
Configure parameters: select the fractal type (3 or 5 bars) and period.
Set up alerts in TradingView to receive notifications about new fractals or breaks.
Use the lines as levels for entry/exit positions, stop-losses, or take-profits in fractal-based strategies.
Troubleshooting: If Levels Are Not Fixed on the Chart
If the levels (fractal lines) do not stay fixed on the chart and fail to move with it during scrolling or scaling (e.g., they remain stationary while the chart shifts), this is typically due to the indicator's scale settings in TradingView. The indicator may be set to "No scale," causing the lines to desynchronize from the chart's price scale.
What to Do:
Locate the Indicator Label: On the chart, find the indicator label in the top-left corner of the pane (or where "BoaBias Fractals High & Lows" is displayed).
Right-Click the Label: Click the right mouse button on this label.
Adjust the Scale:
In the context menu, look for the "Scale" or "Pin to scale" option.
If it shows "Pin to scale (now no scale)" or similar, select "Pin to right scale" (or "Pin to left scale," depending on your chart's main price scale—usually the right).
Refresh the Chart: After changing the setting, refresh the chart (press F5 or reload the page), or toggle the indicator off and on again to apply the changes.
After this, the lines should move and scale with the chart during scrolling (horizontal or vertical) or zooming. If the issue persists, check:
TradingView Limits: The indicator may draw too many lines (maximum ~500 per script). If there are many historical fractals, older lines might not display.
Chart Settings: Ensure the chart is not in logarithmic scale (if applicable) or that auto-scaling is enabled.
Indicator Version: Verify you are using the latest script version (Pine Script v6) and check for errors in the TradingView console.
This indicator is ideal for traders working with Bill Williams' chaos theory or those seeking dynamic support/resistance levels. It is based on standard fractals but with enhancements for convenience: automatic removal of broken levels and integration with the price scale.
Note: The indicator does not provide trading signals on its own — use it in combination with other tools. Test on historical data before real trading.
Code written in Pine Script v6. Original template: Mit Nayi.

Multi Pivot Point & Central Pivot Range - Nadeem Al-QahwiThis indicator combines four advanced trading modules into one flexible and easy-to-use script:
Traditional Pivot Points:
Calculates classic support and resistance levels (PP, R1–R5, S1–S5) based on previous session data. Ideal for identifying key turning points and mapping out the daily, weekly, or monthly structure.
Camarilla Levels:
Provides six upper and lower pivot levels (H1–H6, L1–L6) derived from volatility and closing price formulas. Especially effective for intraday reversal, mean reversion, and finding overbought/oversold extremes.
Central Pivot Range (CPR):
Plots the median, top, and bottom of the value area each session. CPR width instantly highlights whether the market is likely to trend (narrow CPR) or remain range-bound (wide CPR).
Developing CPR projects the evolving range for the current period—essential for real-time analysis and pre-market planning.
Dynamic Zone Levels (DZL):
Automatically detects and highlights clusters of pivots to reveal high-probability support/resistance zones, filtering out market “noise.”
DZL alerts notify you whenever price breaks or retests these key areas, making it easier to spot momentum trades and avoid false signals.
Key Features:
Multi-timeframe flexibility: Use with daily, weekly, monthly, yearly, or custom timeframes—even rare ones like biyearly and decennial.
Modular design: Activate or hide any system (Traditional, Camarilla, CPR, DZL) as you need.
Bilingual interface: Every setting and label is shown in both English and Arabic.
Full customization: Control visibility, color, style, and placement for every level and label.
Historical depth: Plot up to 5,000 pivot/zones back for deep analysis and backtesting.
Smart alerts: Get instant notifications on true S/R breakouts or retests (from DZL).
How to Use:
Trend Trading:
Watch for a very narrow CPR to identify potential trending days—trade in the breakout direction above/below the CPR.
Range Trading:
When CPR is wide, expect sideways movement. Fade reversals at R1/S1 or within the CPR boundaries.
Breakouts:
Use DZL alerts to capture momentum as price breaks or retests dynamic support/resistance zones.
Multi-Timeframe Confluence:
Combine CPR and pivot levels from multiple timeframes for higher-probability entries and exits.
All calculations and logic are fully open.

Quantum Dip Hunter | AlphaNattQuantum Dip Hunter | AlphaNatt
🎯 Overview
The Quantum Dip Hunter is an advanced technical indicator designed to identify high-probability buying opportunities when price temporarily dips below dynamic support levels. Unlike simple oversold indicators, this system uses a sophisticated quality scoring algorithm to filter out low-quality dips and highlight only the best entry points.
"Buy the dip" - but only the right dips. Not all dips are created equal.
⚡ Key Features
5 Detection Methods: Choose from Dynamic, Fibonacci, Volatility, Volume Profile, or Hybrid modes
Quality Scoring System: Each dip is scored from 0-100% based on multiple factors
Smart Filtering: Only signals above your quality threshold are displayed
Visual Effects: Glow, Pulse, and Wave animations for the support line
Risk Management: Automatic stop-loss and take-profit calculations
Real-time Statistics: Live dashboard showing current market conditions
📊 How It Works
The indicator calculates a dynamic support line using your selected method
When price dips below this line, it evaluates the dip quality
Quality score is calculated based on: trend alignment (30%), volume (20%), RSI (20%), momentum (15%), and dip depth (15%)
If the score exceeds your minimum threshold, a buy signal arrow appears
Stop-loss and take-profit levels are automatically calculated and displayed
🚀 Detection Methods Explained
Dynamic Support
Adapts to recent price action
Best for: Trending markets
Uses ATR-adjusted lowest points
Fibonacci Support
Based on 61.8% and 78.6% retracement levels
Best for: Pullbacks in strong trends
Automatically switches between fib levels
Volatility Support
Uses Bollinger Band methodology
Best for: Range-bound markets
Adapts to changing volatility
Volume Profile Support
Finds high-volume price levels
Best for: Identifying institutional support
Updates dynamically as volume accumulates
Hybrid Mode
Combines all methods for maximum accuracy
Best for: All market conditions
Takes the most conservative support level
⚙️ Key Settings
Dip Detection Engine
Detection Method: Choose your preferred support calculation
Sensitivity: Higher = more sensitive to price movements (0.5-3.0)
Lookback Period: How far back to analyze (20-200 bars)
Dip Depth %: Minimum dip size to consider (0.5-10%)
Quality Filters
Trend Filter: Only buy dips in uptrends when enabled
Minimum Dip Score: Quality threshold for signals (0-100%)
Trend Strength: Required trend score when filter is on
📈 Trading Strategies
Conservative Approach
Use Dynamic method with Trend Filter ON
Set minimum score to 80%
Risk:Reward ratio of 2:1 or higher
Best for: Swing trading
Aggressive Approach
Use Hybrid method with Trend Filter OFF
Set minimum score to 60%
Risk:Reward ratio of 1:1
Best for: Day trading
Scalping Setup
Use Volatility method
Set sensitivity to 2.0+
Focus on Target 1 only
Best for: Quick trades
🎨 Visual Customization
Color Themes:
Neon: Bright cyan/magenta for dark backgrounds
Ocean: Cool blues and teals
Solar: Warm yellows and oranges
Matrix: Classic green terminal look
Gradient: Smooth color transitions
Line Styles:
Solid: Clean, simple line
Glow: Adds depth with glow effect
Pulse: Animated breathing effect
Wave: Oscillating wave pattern
💡 Pro Tips
Start with the Trend Filter ON to avoid catching falling knives
Higher quality scores (80%+) have better win rates but fewer signals
Use Volume Profile method near major support/resistance levels
Combine with your favorite momentum indicator for confirmation
The pulse animation can help draw attention to key levels
⚠️ Important Notes
This indicator identifies potential entries, not guaranteed profits
Always use proper risk management
Works best on liquid instruments with good volume
Backtest your settings before live trading
Not financial advice - use at your own risk
📊 Statistics Panel
The live statistics panel shows:
Current detection method
Support level value
Trend direction
Distance from support
Current signal status
🤝 Support
Created by AlphaNatt
For questions or suggestions, please comment below!
Happy dip hunting! 🎯
Not financial advice, always do your own research
